Fastest first Death
No qualified Match for these Filters yet.
TYRSTATS / LIVE DATA
See how Matches on this map unfold from their starting sides to the final result.
Map evidence
Tank
1 Matches match these Filters. Each chart uses the Matches with the data it needs and shows its own sample size. North and south Win rates always use the same Matches.
Smoothed corridors show where qualified Tank Trails cross Map areas. Each Tank counts once per area in the selected Match-clock window; shading does not measure time spent there.
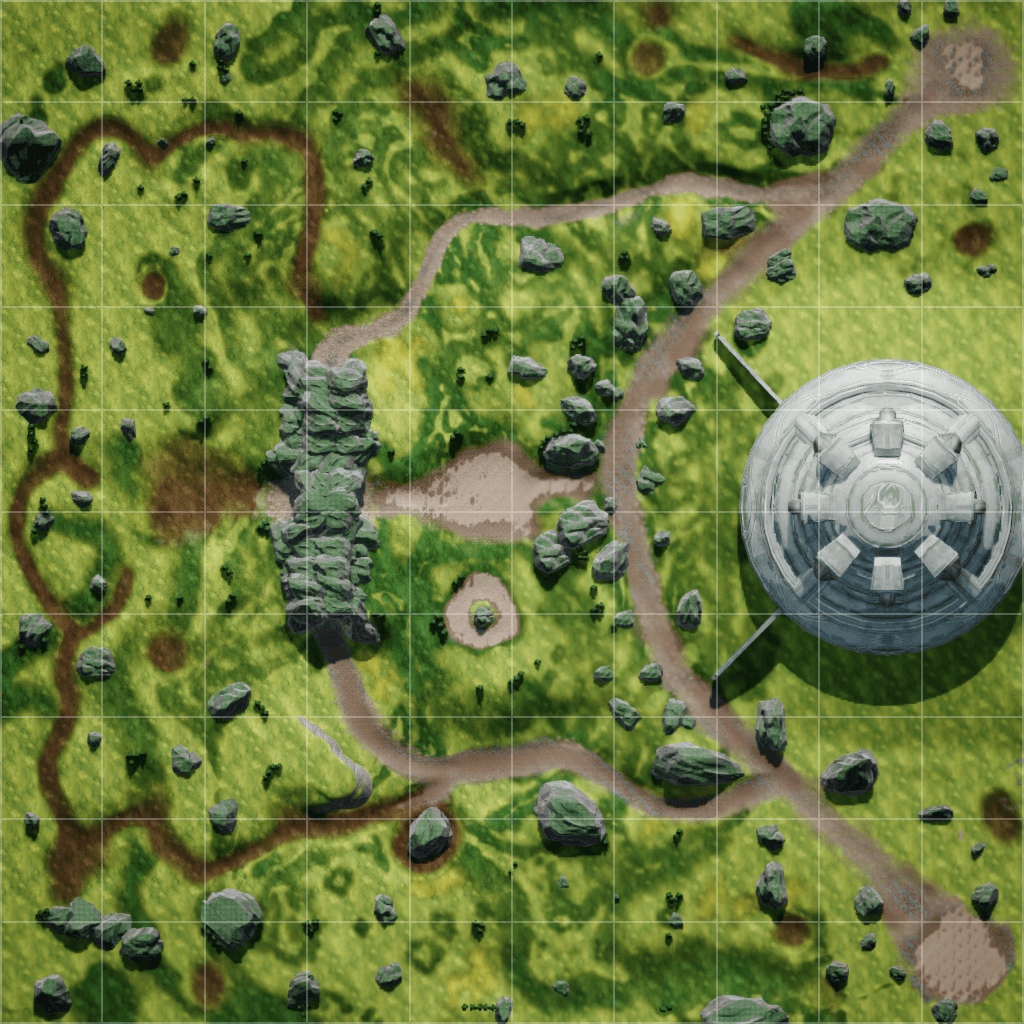
369 qualified Tank-area crossings
1 of 1 selected Matches contribute (100.0% coverage).
16 Player, Match appearances.
1 at risk; 0 finished before this window begins.
Relative intensity within this selection. Peak Map area: 4 Tank appearances. Hover the Map for an area's original value.
Missing positions are omitted. Shading visualizes concentration, not the probability of an event. Filters use the same selected Match pool as the charts below.
Records use the selected Map and Filters. Equal qualified values share the record.
Fastest first Death
No qualified Match for these Filters yet.
Largest comeback
No qualified Match for these Filters yet.
Fastest concluded Match
3:28.74
Winning Team: South starting side
View Match →Death times are observed Replay frames. Fastest Match uses validated raw Replay duration and an official concluded outcome.
Difference between the Teams’ surviving tanks at Match end. Every observed difference is shown.
1 of 1 selected Matches have qualified final counts (100.0% Coverage).
A 6-versus-2 final count has a difference of 4. The result is independent of which Team won or where it started.
| Tank difference | Matches | Share | Approximate 95% interval |
|---|---|---|---|
| 7 | 1 | 100.0% | 20.7%, 100.0% |
Intervals describe uncertainty among eligible uploaded Matches. Missing final observations do not count as zero survivors.
How quickly does the first tank fall, and how often does the Team that avoids that first loss win?
0 of 1 selected Matches have qualified opening timing (0.0% Coverage).
0 qualified Matches had a Death within 90 seconds. 0 had verified no Death.
Time begins at Replay recording start. Disconnect Deaths count once.
The Team whose opponent lost the first tank:
0 Wins among 0 eligible Teams, each from a unique Match.
Coverage: 0.0% of 1 selected Matches.
0 Matches had first losses on opposing Teams at the same recorded timestamp. They are outside this rate. This association does not prove causation.
How often each opening happens, and how often that Team eventually wins.
0 of 1 selected Matches have qualified Starting-side openings (0.0% Coverage).
Frequency uses all qualified opening categories for that side. Eventual Win uses only Teams with known official outcomes. Simultaneous first losses and Matches with no Death stay separate.
A first loss can be a disconnect Death. These comparisons describe associations, not causes.
Teams start on the north and south sides. Both Win rates use the same Matches with confirmed official outcomes.
NorthSouthSame-Match comparison
Both rates compare the same 1 Matches, so they add to 100%. A difference describes these Matches; it does not prove the spawn caused the result.
1 of 1 selected Matches have confirmed official outcomes (100.0% Coverage).
North: 0 Wins in 1 Matches (approximate 95% interval 0.0%, 79.3%).
South: 1 Wins in 1 Matches (approximate 95% interval 20.7%, 100.0%).
Team index identifies the starting side for both Teams in every Match. North and south use the same official outcomes.
A higher Win rate is an association, not proof that the side caused the result.
How often Teams win after falling behind in surviving tanks.
One-tank deficit
0 Wins among 0 Teams with known outcomes, from 0 unique Matches.
0 eligible Teams from 0 Matches reached this deficit.
Threshold Coverage: 0.0% of 1 selected Matches. Qualified progression: 0 Matches.
Each Team counts once per Match at this deficit. Initial Custom-game disadvantages qualify.
Two-tank deficit
0 Wins among 0 Teams with known outcomes, from 0 unique Matches.
0 eligible Teams from 0 Matches reached this deficit.
Threshold Coverage: 0.0% of 1 selected Matches. Qualified progression: 0 Matches.
Each Team counts once per Match at this deficit. Initial Custom-game disadvantages qualify.
Surviving tanks and health over Replay time, compared by starting side.
0 of 1 selected Matches have qualified Team-strength progression (0.0% Coverage).
Starting Roster and health use Replay second 5. The health baseline remains fixed, so remaining health can exceed 100%. Finished Matches leave later samples.
| Replay time | Running | Completed | Eligible | North Teams | South Teams | Coverage while running | North tanks | South tanks | North health | South health |
|---|---|---|---|---|---|---|---|---|---|---|
| 5s | 0 | 0 | 0 | 0 | 0 | — | — | — | — | — |
One Team per Starting side can contribute at each Match-time bucket. Means use qualified Team observations only; Coverage changes as Matches finish.
These aggregate totals do not support a confidence interval for each mean; the table shows the changing sample and Coverage instead.